Table of Contents
Networks, there is no skepticism on the paramount role it plays in any organization. But, what is vital to reckon is that, they need to be governed – particularly with the tangled network structures that endure today.
In a fast paced industry, one would always want to narrow down the human intervention yet have a substantial yield, which defines the fine illustration on how automation of network management results in reduced human effort.
Gone are the days when networks were less complex. A typical network involved primarily one or more mainframes bridged to a handful of peripherals. Hence, managing such networks was comparatively straightforward. Today, NMS plays a pivotal role in governing the intricate tasks of keeping the domains guarded, secured and enhanced for the IT help desk personnel and is the apex priority for any organization. Such is the complex nature of networks today and the complexity has been ceaselessly on the higher side.
Network complexity surfaces predominantly from two facets: the huge number of devices and the melange of devices on the network.
A personal computer for work is a fair need of the day, but there comes the mammoth variety of devices like workstations, file servers, printers, routers, hubs, firewalls and more, without which productivity is hampered from an organizational perspective.
It is always very difficult to choose a software when you are provided with a mixed bag of alternatives. Having the right software which drives the right purpose, in our case the NMS, is the key to success. Well, that’s where OpenNMS echelons to a whole different league – a very well defined network management and monitoring software developed in Open Source Framework, using Java. Yes, it is published under General Public License. You know what it means to an organization! A solution that is enabled with a compelling discovery engine, which automatically configures and manages the network devices without any hassle, rather say human intervention.

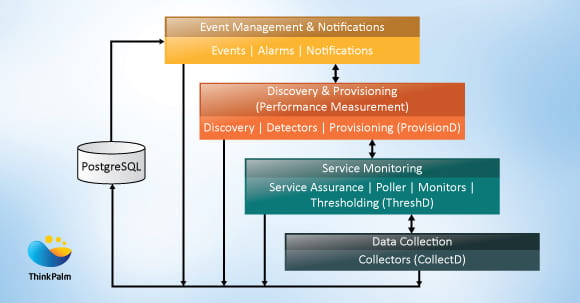
It is based around a “publish and subscribe” message bus. Well, let’s make it simple. We all know, there are several processes that run within a software. These processes can publish events and notifications that any other process can subscribe to. This streamlines event management and notifications in an efficient manner.
There is also a provision in the software, on which it can receive events in the form of SNMP traps, syslog messages, TL/1 events or custom messages. These Events can generate notifications via Email, SMS, XMPP and various custom notification methods.
The advanced provisioning system for adding devices to the network management system makes life easier. We are also provided with an option to list a range of IP addresses to the system (IPv4 & IPv6), from which the process can automatically trigger the advanced provisioning. Scalability is achieved through the asynchronous provisioning process. It has proved to be provisioned networks of more than 50,000 discrete devices as well as networks of single devices, with over 200,000 virtual interfaces.
The availability of network based services can be ascertained with the service assurance feature in the OpenNMS. A wide range of monitoring functions are incorporated to enhance the usefulness of the tool. They vary from very lucid ICMPA pings and TCPA port checks to intricate monitoring like Page Sequence Monitoring and Mail Transport Monitoring. The outage statistics is captured in a database which can be used for report generation.
OpenNMS provides a database for performance metrics, which records diverse data for network protocols including SNMP, HTTP, JMX, WMI, XMP, XML and JDBC. These data can be used to generate reports, and very well can be checked against the thresholds. A distinctly scalable process, which captures close to a million data points every five minutes in an instance, just with the help of SNMP!
SNMP Monitoring: An automated process to monitor network devices and servers, and is often preferred to be configured as a dedicated service on target machines.
Auto Discovery: A prodigious approach to automate an advanced and concise set of sensors for the entire network.
IPV6 Support: The most recent protocol that helps identify and locate the systems on a network and guides the internet traffic.
Interface Error Data: Device data logs for signal intrusion and crippled cables, aimed to avert future problems.
Passive Fault Detection: A network configuration which helps the administrators troubleshoot a device, when it doesn’t render the services it is supposed to.
Fast Polling: A process used to send signals to a network device and to isolate the status of the device. It is also used to determine critical issues with the help of information like packet loss or RTD (Round Trip Delay Time).
Clear Correlation: A process which is used to isolate the problem and address the cardinal error.
Network Discard Data: Mostly, discard data is intentional and is a byproduct of quality standards not being met by the traffic.
Average Response Time Data: The time elapsed between signals reaching network devices and getting received is termed as round-trip time. Network devices are pinged and their response times are recorded.
Power Supply Monitoring: A critical requirement of monitoring the power supply of each device to prevent overheating, supported by OpenNMS.
Utilization and Error Rates: These metrics help assess a network’s ability of informing the network admins when performance meets a set benchmark.
Reporting: Predefined and custom report generation, supported by OpenNMS.